rde-mpr-mira.htm; created: 29 DEC 2001
Vehicle
Aerodynamics 2000
The Use of the MicroProbe System in Coolingsystem Development
Rick Ruijsink
Ruijsink Dynamic Engineering
Introduction
Thermodynamics, aerodynamics and noise
control often place conflicting demands on the cooling airflow,
so knowledge on the airflow is essential to balance these
requirements well. A means to quantify the flowdistribution has a
big advantage over a global flow method.
CFD provides such a detailed information on the flowfield and it
has proven to be an invaluable tool in the development of a
vehicle, in this conference we see many examples. Although the
cooling performance can be modelled to a reasonable extend, good
measurement tools are still required. May-be detailed and
reliable measurements are even becoming more important either to
validate results or to yield valuable input data for numerical
optimisation processes.
The MicroProbe measurement system has proven to be such a tool.
Description of the MicroProbe system
The Ruijsink MicroProbe system is a
much-improved version of a system originally developed under the
NedCar flag. SAE 931105.
The main requirement of the system was to measure the airflow
distribution correctly even under non-uniform, oblique in- and
outflow conditions. The best way to achieve this is to measure
the flow within the radiator matrix itself, only there the
through-flow is well defined.
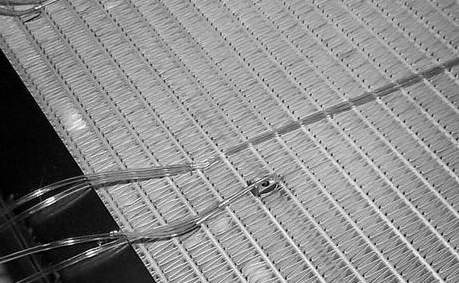
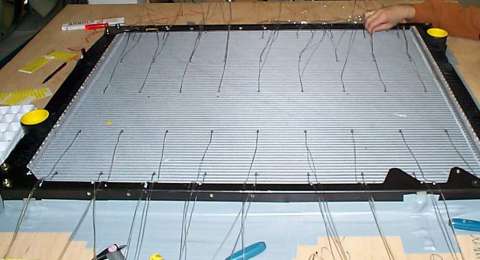
The MicroProbe system consists of up to 48 Pitot-Static probes
mounted inside the radiator matrix. These MicroProbes are
inserted from the rear and are of such a small dimension (20 x 7
x 3.3 mm³), that they do not protrude the front face of the
radiator, consequently no influence on oblique inflow will occur.
On the rear face of the radiator the probes protrude only 3 mm,
not to obstruct even close mounted fan's. The tubes can be
bundled without practical disturbance behind the radiator.
Figure 1 The rear of the radiator with the probes protruding 3 mm
During the measurement of the flowdistribution several other data can be acquired. The system has 6 analogue and 2 digital inputs, one each for air temperature, reference speed and fan rpm, the others are definable by the user.
Figure 2 Block diagram of the system
The data acquisition and -transfer is designed to work reliable under harsh environmental conditions (EMC, etc.), The A-D converters are isolated from the mains and/or vehicle ground and the RS-485 protocol is tolerant, simple, quick enough and allows control from a considerable distance.
Because the differential pressures from the MicroProbes are small one single, high quality differential micro-manometer is used to measure them, with the aid of a double Scanivalve unit. A periodical pneumatic nulling of the transducer eliminates any null drift influence. The front-end also containing the local A/D converter is placed in the vicinity of the radiator. This to realise short pressure tubes, resulting in short pneumatic time lags. A length of 2 meters typically yields 2 seconds for 99% response.
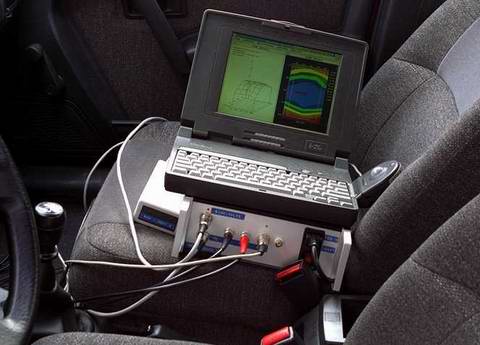
The data-acquisition/power unit is usually placed in the vehicle passenger compartment. The whole system is controlled through a portable PC.
Figure 3 Prototype version of DAQ/Powerunit on seat of passenger car
the data presentation is in the form of a 3D-landscape plot and a 2D plot with iso-velocity contours. The mean-, maximum- and minimum flow is given, together with the other measured quantities. The plot is available immediately after each measurement.
Figure 4 Example of the output plot.
The Windowsâ software for the test set-up, calibration procedure, scanivalve control, data acquisition and -presentation, is intuitive and has a modular structure to allow an easy introduction of new functions.
The Operating Procedure
The procedure starts with careful planning, what configurations to measure, what additional measurement data will be acquired, where to place the probes, how to place the tubes and the electrical wires, where to place the boxes etc.
The next step is the installation of the probes in the test-radiator. This shall be performed carefully and will take about one day.
Figure 5 The installation of the probes from the rear.
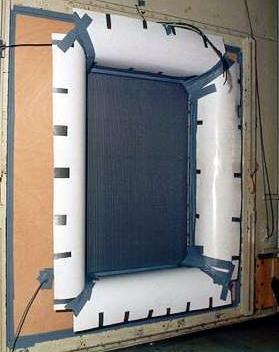
Before the actual measurements the probes in the test radiator are individually calibrated. This requires a calibrated test rig, one that is normally used in coolingsystem development. A bellmouth is placed in front of the radiator, in a properly designed testrig this is enough to ensure an even airflow distribution.
Figure 6 A bellmouth in front of the radiator during calibration.
With a known flow the velocity versus differential pressure characteristic of each probe is determined. These calibration curves are stored in an analytical way to perform a back-fit during the measurement. The calibration procedure including the installation and de-installation of the test-radiator on the testrig usually is performed in less than one day.
The calibrated probe/radiator can be retained for about a year before re-calibration is required. Careful handling and clean storage is required.
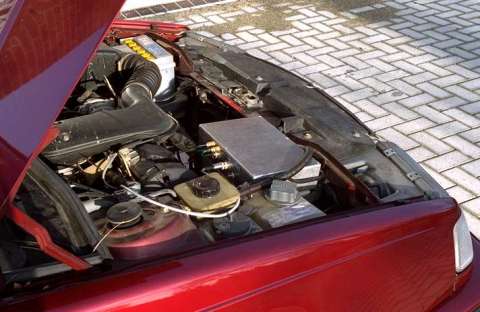
The actual measurements can be performed on the testrig with grill, shroud, fan and/or (dummy)motor, or it can be mounted in a vehicle. The system has been used successfully in claymodels, mock-up's, prototypes and production vehicles. The installation time of the system in a vehicle is a matter of hours, depending on the mechanical actions required.......
Figure 7 The Scanivalve box in the engine bay of a passenger car.
The fact that several other measurements can be taken simultaneously is helpful, during road tests e.g. the windspeed, throttle angle and cooling water temperature can be measured when the proper sensors are hooked up to the system.
One flow distribution i.e. one configuration will be measured in about 4 to 5 minutes. The results are available immediately after each measurement. This is one of the big advantages over most other systems. A direct visible result avoids the frustration of repeating a whole range of measurements due to some silly mistake that is only discovered after the data reduction a day later, also when required, the test program can be adjusted on the fly based on the actual results.
Some Observations Based on Cooling Airflow Measurements
The ability to measure the airflow through the radiator under driving conditions has shown that a big difference in ram air influence can occur with different vehicles. Some trucks e.g. show complete fan domination up to 90 km/h while others have a distinct Ram Air influence at higher speeds. Most passenger vehicles show a much bigger Ram Air influence. The design of the grill is more important at a high Ram Air ratio and vice versa.
Figure 8 The Ram Air Influence of some different vehicles
The flow through the radiator in the no ram condition is often considered to be proportional with fan rpm. This is not entirely true, especially in the lower rpm regions. In this area the Reynolds effects in the radiator matrix are probably responsible for an increase in air resistance, resulting in a lower flow rate.
Graphs of the airflow as function of rpm don't show these effects well. Also differences between variants are not very clear in the lower rpm ranges. The next plot shows two fan's in the same vehicle (one fan optimised with the aid of the flow distribution measurements with MicroProbe). For each fan two plots are presented, one in the beginning of the development, the latter with the same fan, 7 month later. The vehicle was the same, in the early tests however an electric fan drive was used not capable of reaching the highest operational fan speed.
Figure 9 Mean Volume Flow versus Fan rpm for two different Fan's
The reproduction of the tests looks perfect, the improvement of the fan performance is very significant.
A more informative way to present the data is to plot the 'reduced velocity' as function of rpm. The 'reduced velocity' is the mean (or local) velocity, divided by the fan speed, or rpm/1000 as given in the next plots.
Figure 10 Reduced Velocity versus Fan rpm for two different Fan's
First the differentiation between the distinct curves is enhanced, even when the ordinate was crossing at zero. Here we see that the curves don't coincide perfect but just very well. It shows that the new fan in the more definitive form is better than the prototype version, while the reference fan seems to be a little better in the second test.
Furthermore it is clearly distinguished that the flow in the lower rpm ranges is some 25% lower than that at higher speeds. This effect was not known by many of our clients, and lead to overestimation of the cooling performance in idle conditions that were now understood better. The shape of the curve is for different fans as well as shroud/radiators. Also gaps between fan and radiator play a significant role on these phenomena.
Figure 11 Reduced Velocity versus Fan rpm for two different Fan's
In this example another vehicle/radiator/shroud shows for both fans a significant effect around 6-800 rpm. The cause of this phenomenon has not been examined, but the effect is clearly visible in this view. Evident is that the flow in the centre of the fan is over-proportionally higher in the highest rpm plot.
Figure 12 Reduced Velocity versus Fan rpm for two different Fan Speeds
When the reduced velocity is defined as velocity divided by fan revs per second, the reduced velocity becomes the flow advance in meters (SI units) per revolution of the fan. This gives an easily interpretable information on operating points when the geometrical pitch of the fan is known.
The gap between the radiator matrix and the tanks that exists in most radiators spills more air than one usually realises. This air is not effective for cooling and is a complete waste.
A spill of 6% has found to be quite common, in some radiators values of up to 10 % were measured, only the very good ones reach 4%.
Bearing in mind that these 4 to 10 % have to be generated by the fan the waste becomes clear in terms of fan power. In case where there is a lot of ram air the Cd influence important, with the actual fuel prices it becomes as important as in the early 80's.
Conclusions
A good knowledge of the airflow and its distribution over the radiator is required to achieve the right balance between the conflicting front-end design goals.
The MicroProbe System here described measures the flow inside the radiator core volume itself. The information on the detailed flow distribution offers clues to improvements in the cooling system that were not or not so quickly found with conventional methods.
The preparation time for a measurement is short and the productivity is so high that it can be used in even the most expensive windtunnel.
Copyright
© 1999 Ruijsink Dynamic Engineering. All trademarks shown are
trademarks of their respective owners. All rights reserved.
http://www.ruijsink.nl, designed by Rick Ruijsink